LOGO-ENG

Dashboard of Data System –
Expenditures and Revenues, Central Bureau of Statistics (CBS)

Company: Central Bureau of Statistics (CBS)
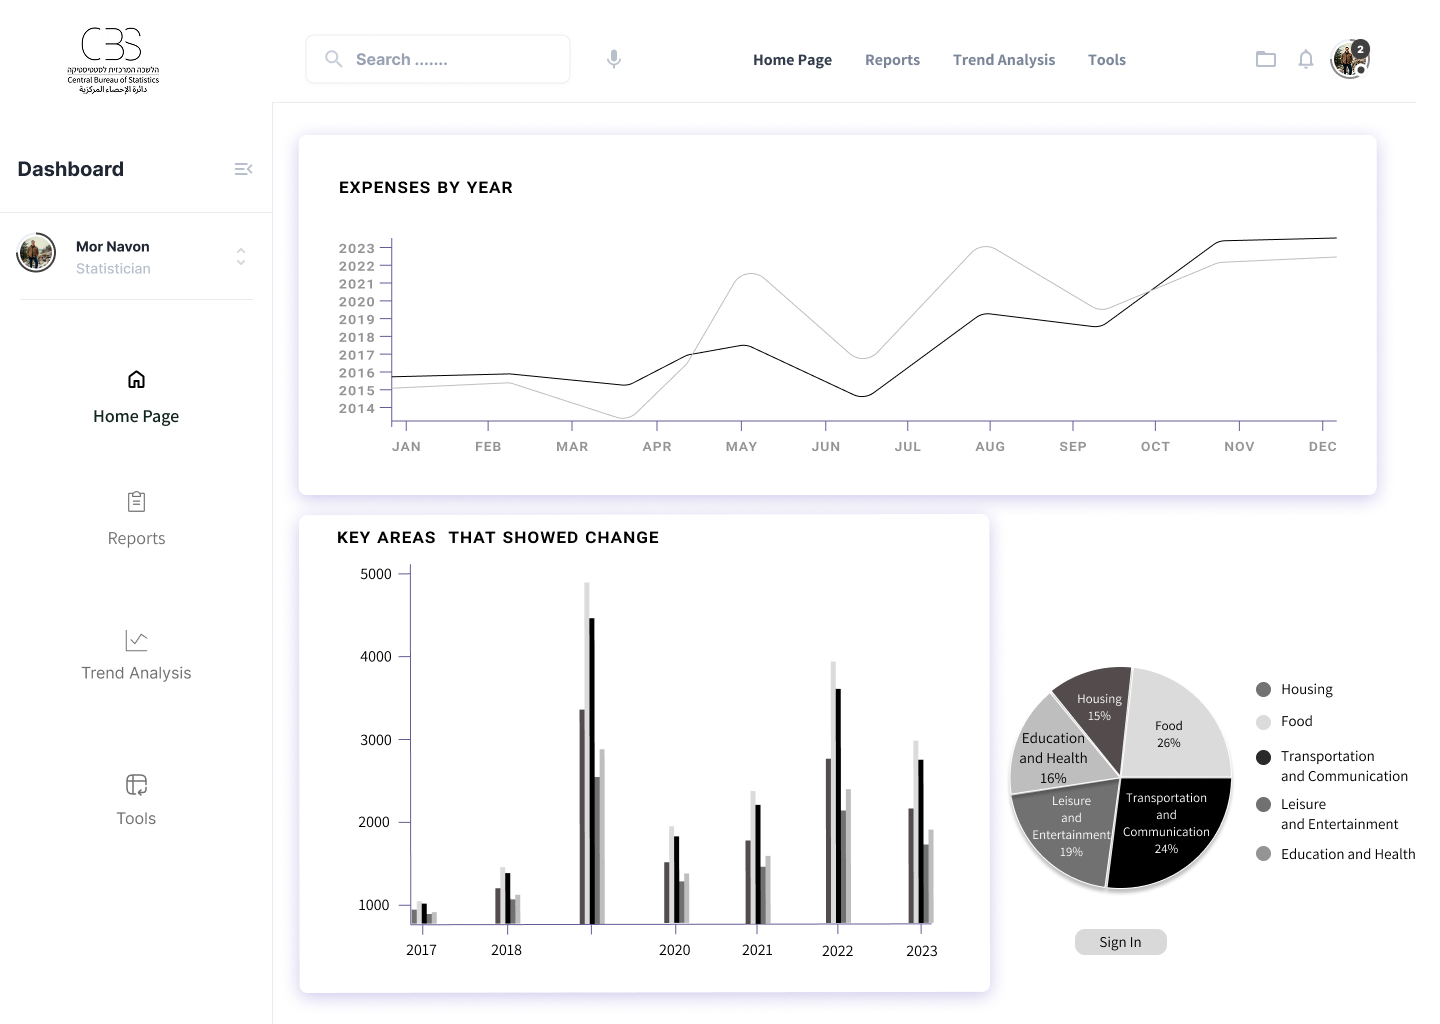
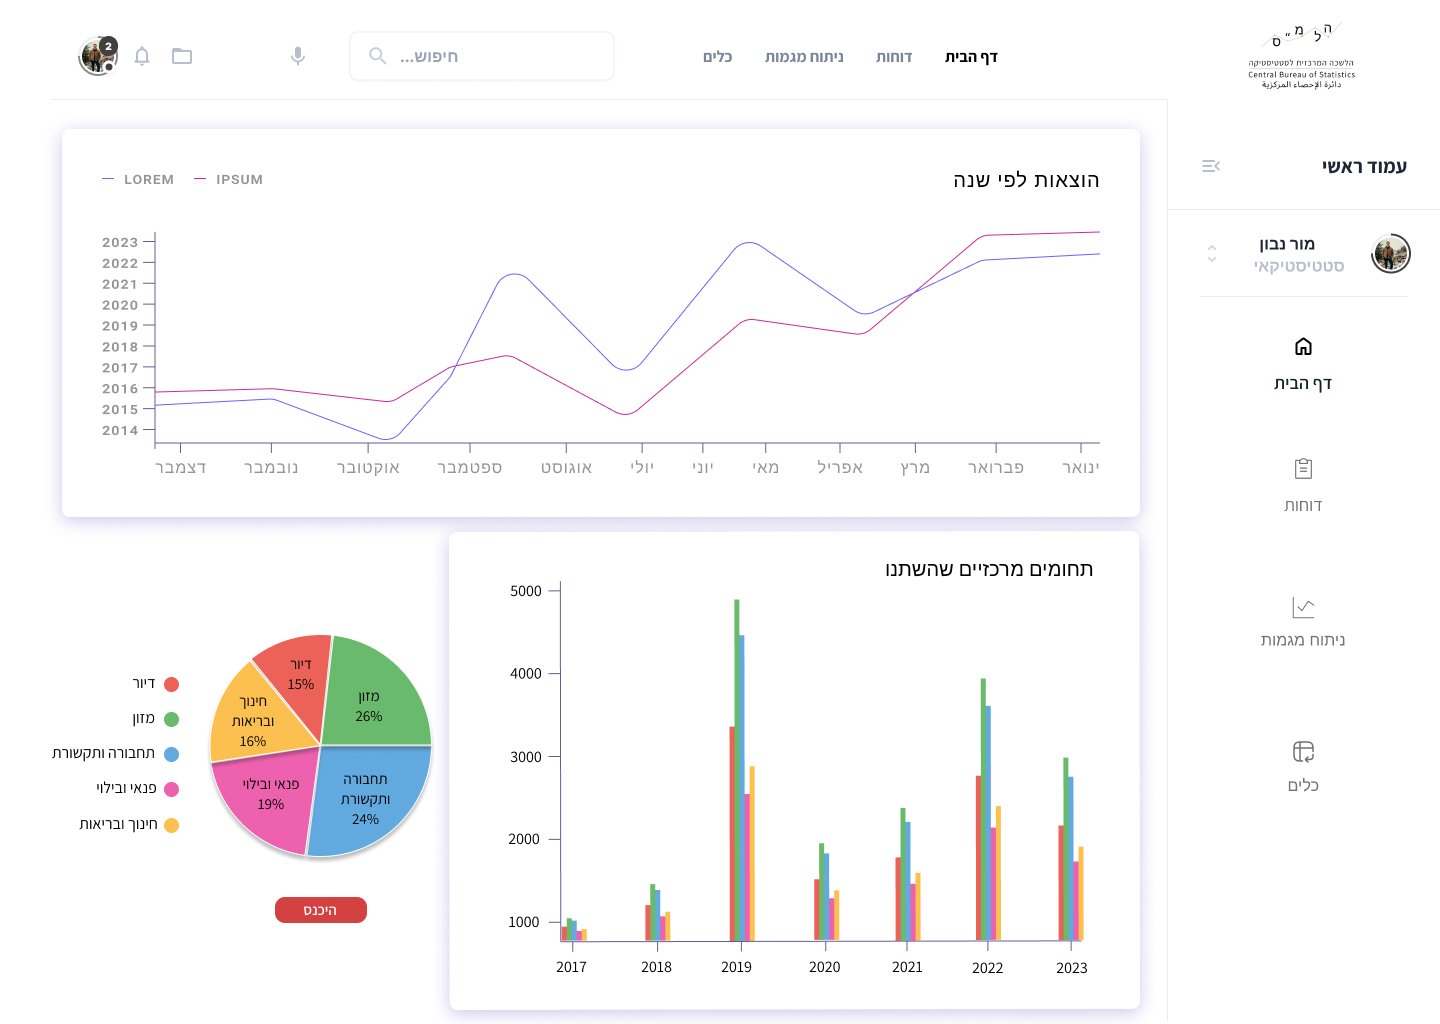
Product Name: Income and Expenditure Data Dashboard, 2019–2020
(Based on: Table A – Composition of Household Consumption Expenditures 2019–2022, Central Bureau of Statistics)
Field: Household Income and Expenditure Systems

My Role: Prototype Development, UX Design, UI Design

The Problem

Background – Household Expenditures
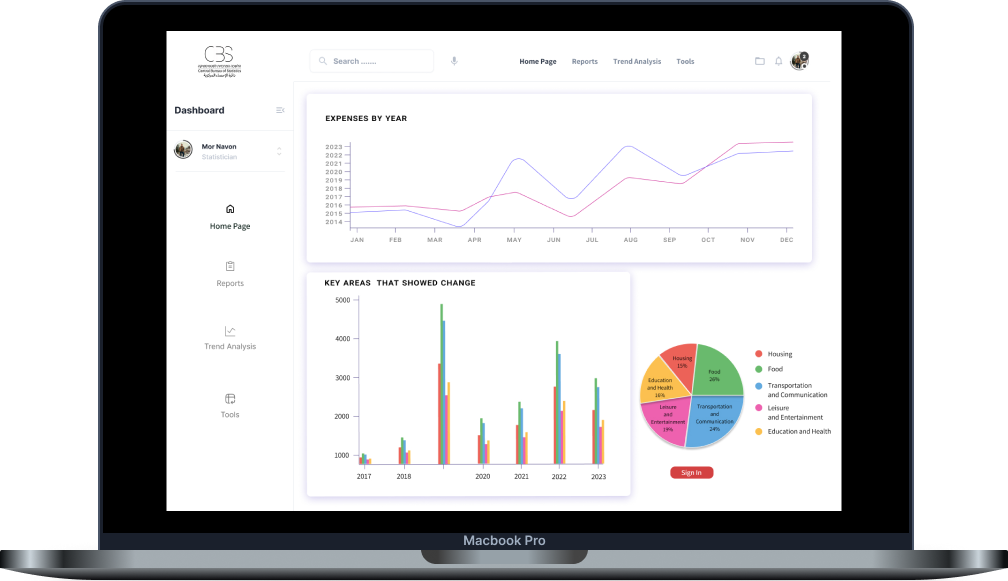
Before the COVID-19 outbreak in 2019, the average household consumption expenditure in Israel totaled NIS 15,900. The largest expenses were for housing (25%), transportation and communication (19.3%), and food (17.6%).

During the pandemic in 2020, household expenditures dropped significantly, the average household consumption expenditure fell to NIS 13,517, a real decrease of 14.9% compared to 2019. This decrease occurred across most consumption categories.

The sharpest declines were in transportation and communication (34.8%), clothing and footwear (32.2%), and education, culture, and entertainment (25.3%).

By the end of the pandemic in 2021, after the initial economic slowdown, expenditures began to rise again but had not yet returned to pre-pandemic levels. The average household consumption expenditure reached NIS 15,122, a real increase of 10.4% compared to 2020.

After COVID-19, in 2022, the average household consumption expenditure continued to rise, reaching NIS 17,600, a real increase of 12% compared to 2021. This increase resulted from several factors, including the recovery of the economy (leading to higher household incomes), the lifting of travel restrictions, and the return to in-office work, which led to higher spending on transportation, leisure, and dining out.

Household Income
During the pandemic in 2020, due to the prolonged lockdowns and economic crisis, there was a real decrease of 8.4% in employment income and 10.5% in capital income compared to 2019.

To mitigate the impact on households, the government provided financial support such as grants for all citizens, unemployment/compensation payments, and tax authority relief for the self-employed. Consequently, social benefits and allowances increased by 39% in real terms compared to 2019.

This government assistance helped limit the overall decrease in household income. In 2020, the average gross monthly income was NIS 19,287, compared to NIS 19,752 in 2019 (a real decrease of 1.8%). The average net monthly income was NIS 16,320, compared to NIS 16,559 in 2019 (a real decrease of 0.9%).

Toward the end of the crisis in 2021, there was a real increase of 2.9% in employment income compared to 2020. However, when compared to 2019 (pre-pandemic), the average monthly employment income was still 5.9% lower in real terms. Social benefits and allowances remained high in 2021, averaging NIS 3,137 compared to NIS 2,435 in 2019 (a real increase of 27.9%) because government support continued through the first half of 2021.

The gross household income rose 1.8% in real terms (from NIS 19,287 in 2020 to NIS 19,916 in 2021), and the net income rose 0.5% (from NIS 16,320 in 2020 to NIS 16,649 in 2021).

After the pandemic, in 2022, there was a real increase of 11.2% in average monthly employment income. This resulted from the recovery of the Israeli economy — renewed growth led to increases in employment rates, wages, and working conditions. The end of unemployment benefit payments in late 2021 and the increased demand for workers contributed to a rise in the average number of earners per household, from 1.28 in 2021 to 1.41 in 2022.

In 2022, the gross monthly household income increased 6.1% in real terms (from NIS 19,916 in 2021 to NIS 22,013 in 2022), and the net income rose 6.1% (from NIS 19,916 in 2021 to NIS 20,013 in 2022).

Project Goal

To present household income and expenditure data divided into categories and displayed in a management dashboard, enabling decision-makers to make data-driven decisions based on the presented insights.

System Objectives

  • Present data to CBS management.
  • Improve the workflow and experience of team members.
  • Create a smart, accessible, and unified management system for all CBS teams.


Target Audience

The system is designed for all CBS staff, primarily statisticians, including:

  • Data Analysts / Data Scientists
  • Socio-Economic Researchers
  • Economic Analysts
  • Economists
  • Socio-Economic Policy Officers

Business Model

The Central Bureau of Statistics (CBS) provides statistical data to the public and government to support decision-making, policy planning, and service improvement.

Existing Modules:

  • Academic institutions
  • Business companies
  • Private sector entities
  • Research Division of the Bank of Israel

Development Phases

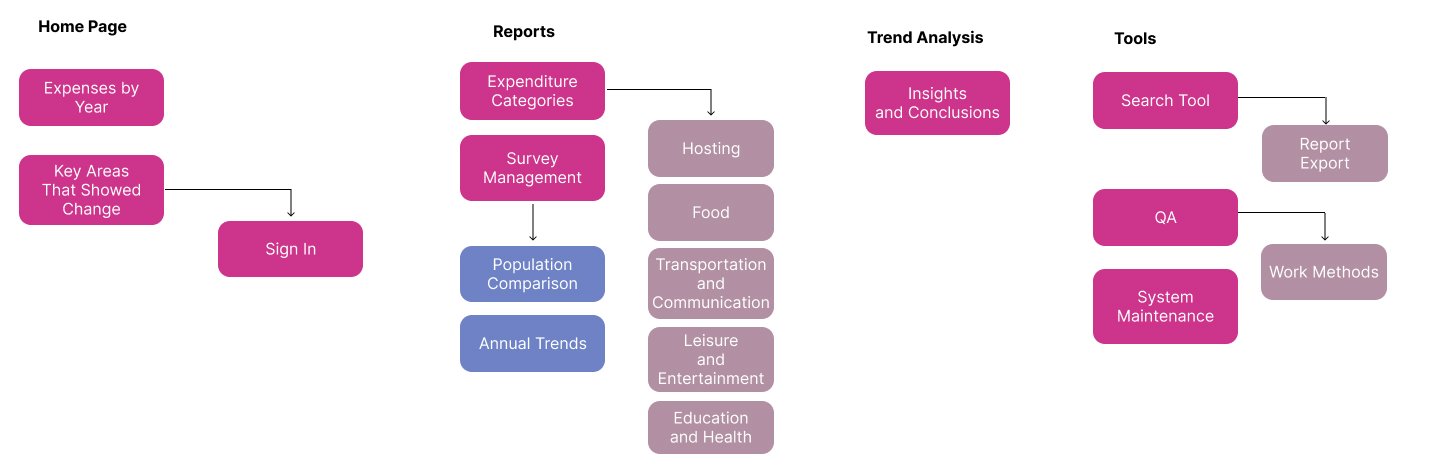
Phase 1: Initial dashboard presenting data on household expenditures by year and key categories, plus additional pages designed according to the system’s information architecture.
Phase 2: Development of a public-facing application.

The Solution

To identify challenges faced by CBS staff, I conducted user research including questionnaires and interviews with team members and management:

  • 5 Data Analysts
  • 2 Social Researchers
  • 2 Economic Analysts
  • 1 Economist
  • 1 Socio-Economic Policy Officer
  • 3 Stakeholders

User Research

I prepared a set of focused questions exploring user workflows and pain points, which I used in both interviews and questionnaires.

  • 6 Interviews
  • 14 Respondents
  • 8 Questions

To uncover the root causes of problems and gain a deep understanding of user behaviors and needs, I conducted in-depth interviews with stakeholders and distributed surveys to department staff.

The key insights focused on identifying unmet needs and pain points in the existing system. this process helped reveal what was missing and what required improvement in the overall workflow.

Would you like me to adapt this into a professional case study format (with titles, visuals, and UX design language for a portfolio)? I can make it look like a polished project summary for Behance or your UX portfolio.

Role Analysis

Table A – Composition of Household Consumption Expenditures 2019–2022, Central Bureau of Statistics

Job Level

Employee Rank – High Rank


Reports to Supervisors


Role – Consumption and Financial Sector

Familiarity with the System

Highest level of control

Required Knowledge and Skills

  • Statistics and Economics
  • Finance, Labor Market, and Social Welfare
  • Data Analysis and Information Systems
  • Social and Behavioral Fields
  • Writing Skills, Critical Thinking, Collaboration with Professional Team Members

Role-Dependent Objectives

  • Measure the standard of living of the population under study
  • Examine the distribution of income across different populations
  • Provide accurate data to government ministries for economic decision-making
  • Describe economic trends
  • Provide reliable information to the general public

Task Analysis

  • Collect and process survey data from field researchers
  • Process and analyze statistical data
  • Write reports
  • Coordinate with professional entities and collaborate with government ministries
  • Manage surveys and maintain data systems of databases
  • Trend analysis – extract insights and conclusions from data analysis
  • Quality control and improvement of work methods

Tools

  • Statistical Tools: SPSS, R, Python, Methodological and Technological Tools
  • Databases: SQL, Excel
  • Internal Survey Systems

Task Analysis and Priority Ranking

Priority Score (sum)
15
10
13
13


13
14
14
12
11
11


12
13
13
13
13
13
10


13
11
13


11


10
13
15
11


11
14
12
14


11
8
11
10

Frequency
5
3
3
3


3
4
4
2
2
2


2
3
3
3
3
3
1


3
4
5


4


4
5
5
4


3
4
3
4


3
2
2
5

Complexity
5
2
5
5


5
5
5
5
4
4


5
5
5
5
5
5
5


5
3
3


2


1
3
5
4


3
5
5
5


5
3
4
1

Importance
5
5
5
5


5
5
5
5
5
5


5
5
5
5
5
5
4


5
4
5


5


5
5
5
3


5
5
4
5


3
3
4
4

Task 1: Collecting and Processing Data from Field Surveys

  • Receive ongoing survey data from households.
  • Check data quality.
  • Routine work with raw data databases.


Task 2: Data Processing and Statistical Analysis

  • Use software like SPSS, R, Python, SAS, Excel to:
    • Calculate averages, metrics, standard deviations, and real/nominal declines.
    • Compare data between years, deciles, and population groups.
    • Generate tables and graphs for official reports.
    • Clean data and apply sampling weights.


Task 3: Writing Reports and Official Publications

  • Draft findings in reports such as:
    • Household Expenditure Survey results
    • Income and expenditures by deciles
    • Ownership of sustainable goods, etc.
  • Write press releases in language accessible to the public.
  • Formulation of findings and conclusions.


Task 4: Coordination with Other Professional Entities

  • Work with other units within the Central Bureau of Statistics (CBS).
  • Collaborate with government ministries – Ministry of Finance, Ministry of Welfare, Ministry of Economy, and Bank of Israel.
  • Respond to external inquiries from research, media, and the public.


Task 5: Maintaining Information and Data Systems

  • Update ongoing data repositories.
  • Check consistency with past data.
  • Generate Public Use Files (PUF) for researchers.


Task 6: Trend Analysis and Drawing Economic Insights

  • Identify changes in consumption habits or income structure.
  • Analyze the effects of economic events.
  • Derive conclusions that help policymakers and researchers.


Task 7: Quality Control and Improvement of Methods

  • Update sampling methods and weighting in line with international standards.
  • Improve data quality and reduce survey errors.
  • Analyze reliability and measurement biases.

Nice to Have

Data Cleaning and Applying Sampling Weights

  • Important to ensure the accuracy and consistency of the data before analysis.

2. Formulation

  • Important to clearly present findings and conclusions for effective communication.

3. Responding to External Inquiries from Research, Media, and the Public

  • Important for transparency and providing accurate information to stakeholders.

4. Quality Control, Methodology, and Improvement of Methods

  • Important to ensure that data collection methods are effective and reliable.

5. Updating Sampling Methods and Weighting According to International Standards

  • Important to maintain the integrity and comparability of the data with global standards.

6. Analyzing Reliability and Measurement Biases

  • Important to assess the validity and precision of the survey results.

Important

1. Data Quality Check

  • Important to ensure the reliability and accuracy of the data collected.

2. Routine Work with Raw Data Repositories

  • Important for ongoing data management and validation.

3. Use of Software

  • Important for accurate data processing and analysis (e.g., SPSS, R, Python).

4. Generating Tables and Graphs for Official Reports

  • Important for clear communication of findings to stakeholders.

5. Formulating Findings in Reports

  • Important for providing actionable insights to decision-makers.

6. Coordination with Other Professional Entities

    • Important for effective collaboration and ensuring the quality of data and analysis.

7. Maintaining Information and Data Systems

  • Important for the accuracy and consistency of the database.

8. Producing Public Use Files (PUF) for Researchers

  • Important to allow access to anonymized data for academic research.

9. Identifying Changes in Consumption Habits or Income Structures

  • Important for understanding economic behavior and guiding policy decisions.

10. Analyzing the Impact of Economic Events

  • Important to evaluate the economic consequences of major events or policy changes.

11. Improving Data Quality and Reducing Survey Errors

  • Important for increasing the reliability of the data and the accuracy of findings.

Critical

1. Collecting and Processing Data from Field Surveys

  • Receiving ongoing survey data from households.
  • Critical to ensure accurate and up-to-date data.


2. Processing and Analyzing Statistical Data

  • Calculating averages, metrics, standard deviations, and real/nominal declines.
  • Comparing data between years, decides, and population groups.
  • Critical to accurately assess trends and make informed decisions.


3. Writing Reports and Official Publications

  • Writing press releases in language accessible to the public.
  • Collaborating with government ministries.
  • Updating ongoing data repositories.
  • Checking consistency with past data.
  • Critical for transparency and informed policy-making.


6. Trend Analysis and Drawing Economic Insights

  • Deriving conclusions that help policymakers and researchers.
  • Critical to guide economic decisions and policy reforms.

User Story & User Scenario

User Story

Name: Mor Navon
Role: Senior Statistician in the Consumption and Finance Department at the Central Bureau of Statistics (CBS)
Goal: To understand how household spending patterns in Israel changed between 2019 and 2022, especially in the wake of COVID-19.

Mor begins his day with a cup of coffee and a quick glance at the data dashboard. He knows that the data he's working on, thousands of tables from household expenditure surveys, are not just numbers; they represent the economic story of all of us.
In recent years, since the outbreak of COVID-19, Mor has noticed sharp changes in consumption patterns: a significant drop in spending on transportation and communication in 2020, a sharp rise in spending on food and housing, and a shift in online shopping behavior.

Mor's Task
 Today, Mor needs to prepare a comparative analysis between 2019 and 2022 that will illustrate how Israeli families adjusted their economic habits to the new reality.
 He uses visual analytics tools, filters the data by income deciles, and creates graphs that tell a story:

  • Middle-to-low-income families shifted to bulk buying during sales.
  • People aged 30-40 spent more on housing and private transportation, less on leisure.
  • Spending on communication increased because work and learning shifted to home.

The Challenge in the Process
 Mor knows that the audience for the report is policymakers in government ministries, and they don’t read tables. They need to understand the insight, not the data point.
 Mor adds a simple graph with the message:
"The average household buys less but more smartly."

Finally,
The report is published to the public, and Yossi's data is cited in articles about the cost of living.


User Scenario

Information Architecture

Tools

Search Tool – Report Export

QA – Work Methods

System Maintenance

Trend Analysis

 Insights and Conclusions

Reports

 Expenditure Categories:

  • Hosting
  • Food
  • Transportation and Communication
  • Leisure and Entertainment
  • Education and Health

Survey Management:

  • Population Comparison
  • Annual Trends

Home Page

 Expenses by Year

Key Areas That Showed Change

Sign In Button

User Scenarios
As Mor, a Senior Statistician in the Consumption and Finance Department at the Central Bureau of Statistics,
I want to collect the survey data, ensure the data is accurate, identify changes in consumption habits,
in order to write a report, convey insights to decision-makers, and publish the findings to the general public.

Screen
Hihg-fidelity (hi-fi) Wireframes

Designed Screen

תפריט נגישות

Scroll to Top